
More than half of all children attending public schools in the United States are living in poverty. As the unequal distribution of wealth has become new norm, science education has stagnated. Perhaps these two might be connected to one another, reflecting a global pattern among developed nations?
Think again:
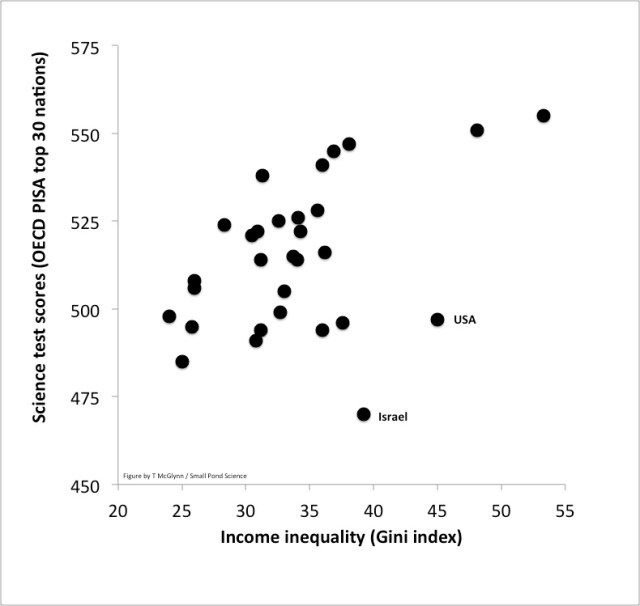
This relationship is the opposite of what I expected to find among developed nations.
This is fascinating, and troubling.
After looking at a few other variables, I’ve realized that I can’t even come close to understanding it, yet. Yes, higher Gini index values means greater income inequality: a greater gap between rich and poor.
Sources: http://en.wikipedia.org/wiki/List_of_countries_by_income_equality; http://www.businessinsider.com/pisa-rankings-2013-12

What other variables have you considered?
I looked at religiosity, geography, per capita income. Then I just made the figure and shared it.
Wow, fascinating and troubling… But I have to suspect some important covariate(s) is missing. Consider their general conclusion:
” High-performing school systems tend to allocate resources more equitably across socio economically advantaged and disadvantaged schools.”
Yes, it looks like in every nation (except the US and Israel), the more stinking rich the wealthy people are, the more they invest into the education of the underclass. Is that really true? I don’t know. I did not expect this.
I doubt this is really true — I suspect a more likely explanation is that Simpson’s Paradox (http://en.wikipedia.org/wiki/Simpson%27s_paradox) is causing a positive trend, and one or more important variable(s) is missing. Either way, it’s interesting…
Out of sheer curiosity, I checked to see if there was a correlation between science test scores and per capita military expenditure (http://en.wikipedia.org/wiki/List_of_countries_by_military_expenditures). Among 18 countries in which I found data for both, there was not — until you remove a major outlier (Singapore — unique in many ways, such as being a sovereign city-state), in which case P ~ 0.011, and the correlation is negative. This isn’t to say that one variable necessarily has any causal effect on the other.
I’d be interested to see data on mean expenditure per student (not as % GDP), but I can’t seem to find it with a quick Google search.
Exactly. It’s maddening, to me at least, to imagine what variables positively associated with income inequality that might be driving this. Or, more generally, to understand how the insane concentration of wealth in the hands of a few might affect — or not affect — the general population.
I think if you really explore the attitudes of many parents (including lots of families with higher incomes) with regard to math and science, you will find that they are extremely negative. After all, when was the last time they even used algebra? They see themselves as not being math and science people. And, they are either unwilling or cannot afford tutoring for their children who just might need a little bit of special attention in order to succeed in these fields of study.
Another thing, parents from lower income areas may have even greater motivation to push and encourage their children. And, some children may be highly motivated to study so that they can leave their surroundings at some point in the future.
Furthermore, children often study what they are interested in and ignore what does not fascinate. Grades and test scores are not necessarily an indication of interest and aptitude. Grades and test scores are not always strongly correlated with high levels of creativity and inventiveness, to my knowledge.
I found the same thing (although I used the 2010 science PISA scores). When I regresses Pisa against Gina I got a significant negative relationship:
Model:
Pisa = Gina
Coefficients:
Estimate Std. Error t value Pr(>|t|)
(Intercept) 578.2901 31.8503 18.157 2e-16 ***
Gini -3.0716 0.8722 -3.522 0.000851 ***
Multiple R-squared: 0.1787, Adjusted R-squared: 0.1643
But I was curious how this might be affected by money spent per student. I couldn’t find this online so I took per capita GDP * % of GDP spend on education / % of population under 15 ( all taken from Wikipedia). When you PISA against MnyPrStdnt you see that at first PISA rises with increasing money per student but levels off at about $10,000 USD per year. It’s late so I just fir this with a polynomial function. It comes out with a pretty high R-squared ( 0.8135). When model both factors together Gini is no longer explains any variation in the data:
Pisa = Gini + MnyPrStdnt + MnyPrStdnt^2
Estimate Std. Error t value Pr(>|t|)
(Intercept) 3.686e+02 2.206e+01 16.71 <2e-16 ***
Gini 5.813e-02 4.857e-01 0.12 0.905
MnyPrStdnt 2.065e-02 1.527e-02 13.52 <2e-16 ***
MnyPrStdnt^2 -6.941e-07 5.970e-08 -11.63 <2e-16 ***
Multiple R-squared: 0.8135, Adjusted R-squared: 0.8034
So I think this is the case of the Simpson’s Paradox as Brad suggested. If you want my data just let me know.
Cool. When you look at the full dataset, it does seem that Simpson’s paradox is applying with the functional variable being, it seems, per-student investment. But Simpson’s paradox isn’t a true paradox, and in a subset (such as, wealthy nations), there could be additional variables that work in the model. The fact remains that, among the highest-performing countries, the best performance comes from places with the greatest inequity in the distribution of wealth. The regression line won’t be significant among all nation, but does matter among wealthy nations.
I also find it surprising that in the full model, that the distribution of wealth doesn’t have an effect. I’m interested in modeling this a lot more, but my collaborators and students are more interested in the manuscripts that await.
What is also interesting to me is that the highest preforming countries (> 475 PISA scores) spend more money per student than the lower performing countries (< 475 PISA scores), but within the group of high performing countries additional money spent per student on education does not seem to have any effect on PISA scores. In spite of the fact that there is 3 fold variation in the amount of money spent per student within this group. Maybe if I added in a purchasing power variable we would no longer see additional money having so little effect above 10K per student, or maybe other factors are more important than money once you get above a certain threshold.
Actually in my data set (60 countries) the Gini is negatively correlated with PISA score (like you originally expected), the more uneven the distribution of wealth is, the lower the PISA science scores. However this falls out when we include money spent per student because money spent per student is negatively correlated with the Gini index. Generally countries that spend more on their students, have lower income inequality (and/or visa versa). Once the money spent per student is accounted for in the model, Gini has mo more variation left to explain.
For more detailed modeling of how mean test scores should respond to different distributions of money spent per student, I think I would need to know more about the test. On a country level test scores seem to asymptote with additional resources. Is this the same at the individual level? Also does Gini index even correlate with variance in spending per student? If all countries were like the US it would, but I don't know how many other counties use local taxes to fund public education.
I guess there are probably people who get paid to answer these types of questions, although I never really come across any coverage of this type of stuff in the news. I agree with you, it is very interesting, but I too should get back to work.
I’d be interested to see what you get if you look at median rather than mean scores, or especially, the distribution of scores, in some of these countries. I would guess that some countries have more test score inequality within their populations than others.
Also, the Business Insider table is high school scores – what happens when you look at elementary and middle schoolers?
Could it be related to uneven sampling? For instance if countries with higher income inequality have more school drop outs who therefore don’t get tested.