
I taught biostatistics for several years. You know what was one of bigger challenges of teaching that class? Finding articles to use in class that had straightforward application of the statistical principles that we were learning in class.
Let’s fix that! How about we crowdsource a list of articles that have great examples of common statistical concepts for us to use in teaching? I’ve created a google spreadsheet for this, please feel free to add to it! I’ve gotten it off a start with two papers that I’ve used a lot. (They date to the mid 2000s, because, well, that’s when I started teaching biostats, but they’re still great examples.) Please check out, and add to, this spreadsheet!
Here are a couple figures from one of the papers I added to the spreadsheet (Frederickson and Gordon 2007):
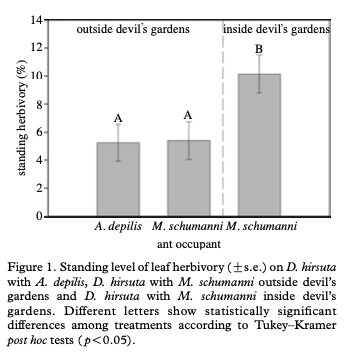

Hark, what is that I see? A straightforward example of an ANOVA with a Tukey post-hoc, in the wild? Can it be?
I have no idea how much time I spent trying to find a paper that had such simple figures with accordingly simple statistics. (Maybe we could just overlook the post I wrote recently about how horrible bar graphs are, amirite? I suppose this would be even better with violin plots or box plots. Anyhow.) It seems that most papers include twists in their stats, unnecessary complexities, bending backwards for a reviewer or something, and maybe something with linear algebra. Which might be just fine for the paper! But if we’re teaching introductory statistics, it’s a good idea to be able to work with examples of straightforward statistics in the literature, that don’t look so different from what we’re teaching. (Even though perhaps the curriculum needs to evolve beyond the classic set of parametric tests that folks tend to start out with.) Do you know the quote attributed to Picasso, it goes like, ‘Learn the rules like a pro so you can break them like an artist.’ Which I would guess he may have said in French or in Spanish?
The whole point of this post is to share this crowdsourced spreadsheet, so we can grow it and so it can be of use to the community of folks teaching statistics in science classes. Let’s get examples from a variety of disciplines, so that no matter what a person is teaching, they can find a good example.
To get this spreadsheet going, two lucky contributors will receive a copy of my book, The Chicago Guide to College Science Teaching. That is, when it becomes available this summer. (I’ll have more details about the book in a post over the next couple months, as soon as it can be pre-ordered.) I’ll check in at noon Pacific, one week from now (that’s 26 Feb 2020), and each row will be an entry for the giveaway. (So the more rows you enter, the better your odds.)
So again, here’s the spreadsheet! Happy teaching!

Hi everyone. Got to second that. And I’d like to take this opportunity to invite Terry and everyone with resources that work to share your ideas in EcoEdDL and other venues offered by ESA.
Thanks for pointing this out! Ecology folks, the link to the EcoEd Digital Library is: https://ecoed.esa.org/ and is a super helpful service from ESA. Perhaps as this list matures, we could assemble it to deposit is EcoEdDL?
This is also a good time to point out that there are a bunch of society-led teaching resources in other fields, too, such as ACS, AAS, and such.
Along the lines of Teresa’s suggestion for EcoEd, Terry, I edit the ‘Communicating Science’ section of The Bulletin of the Ecological Society of America. If you (and/or your students) would be interested in taking on this topic from the angle of enhancing scicomm and/or scicomm training, I’d love to see s pitch or draft manuscript. The section is edited but (usually) not peer-reviewed, and I’m happy to spend plenty of time with authors to refine a manuscript. We might also be able to cross-publisg such a piece in the Teaching Ecology/ Education section of the Bulletin. Feel free to email me if you’re interested, want more info, etc.
Bethann, I am interested in compiling this for a bit of the bulletin! Anybody else reading this, interested in being involved in putting this together. If so, drop me a line by email.
I have a paper, an undergrad as the first author, that is currently in review, that uses both ANOVA and Tukey’s AND presents this with box plots. I’ll be sure to link it if/when it is published.
It seems like this isn’t the perfect fit for what you’re doing, so I didn’t put it in the spreadsheet but just in case: https://www.autodeskresearch.com/publications/samestats
Thanks. Will be using these examples in our Quantitative Biology course at University of Brasília this semester!
simple stats are also great teaching examples for exploring more effective data viz choices. Bar graphs with error bars are often not the best choice for the kinds of statistical analyses depicted above: https://twitter.com/T_Weissgerber/status/1192694904603992064
Reporting on the outcome of the drawing, using a random number generator in the spreadsheet, the two recipients of the book drawing are Drs. Christie Bahlai and Catherine Scott! Thanks to them and everybody else who built this resource!